

Power Factor Correction: Complete Guide with Calculators, Cost Analysis & Real Savings
- Admin: IDAR Mohamed
- 11 Jan 2025
- 0
Power factor correction (PFC) is one of the most overlooked yet profitable electrical improvements businesses can make. With utility penalties costing facilities tens of thousands annually and energy waste reaching 30-50% in some industries, understanding and implementing power factor correction isn't just smart—it's essential for competitive operations.
This comprehensive guide provides step-by-step calculations, real-world cost analysis, equipment selection guidelines, and implementation strategies to help you reduce electricity costs by 10-30% while improving system performance.
What Is Power Factor and Why Utilities Penalize Poor Performance
Power factor (PF) measures how efficiently your electrical system converts power into useful work. It's calculated as the ratio of real power (kW) to apparent power (kVA):
The Three Types of Power Explained
Understanding the power triangle is crucial for effective power factor correction:
-
Real Power (P): The actual power consumed by equipment to perform work—lighting, heating, mechanical movement. Measured in kilowatts (kW).
-
Reactive Power (Q): Power required to create and maintain magnetic fields in inductive equipment like motors, transformers, and ballasts. Doesn't perform useful work but is essential for equipment operation. Measured in kilovolt-amperes reactive (kVAR).
-
Apparent Power (S): The total power supplied by the utility, combining real and reactive power. Measured in kilovolt-amperes (kVA).
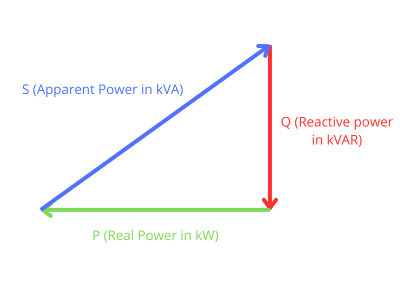
The relationship: S² = P² + Q²
The power factor is the cosine of the angle between real and apparent power, with 1.0 (unity power factor) being ideal.
Why Utilities Impose Power Factor Penalties
Utilities must size their infrastructure (transformers, cables, generators) based on apparent power, not just real power. Poor power factor means they're supplying more current than necessary, requiring larger equipment and higher operational costs.
Common Utility Penalty Structures:
| Power Factor Range | Typical Penalty | Impact on Bills |
|---|---|---|
| 0.95 - 1.00 | No penalty | Baseline cost |
| 0.90 - 0.94 | 1-5% surcharge | $500-2,500/month* |
| 0.85 - 0.89 | 5-10% surcharge | $2,500-5,000/month* |
| 0.80 - 0.84 | 10-15% surcharge | $5,000-7,500/month* |
| 0.75 - 0.79 | 15-25% surcharge | $7,500-12,500/month* |
| Below 0.75 | 25-30% surcharge | $12,500-15,000/month* |
*Based on 500kW facility with $10/kVA demand charge
The Hidden Costs of Poor Power Factor
Beyond utility penalties, poor power factor creates cascading problems throughout electrical systems:
1. Infrastructure Strain and Capacity Reduction
Higher currents from poor power factor force premature upgrades:
- Transformers operate at higher loading
- Cables carry unnecessary current
- Switchgear experiences increased stress
- Available capacity for new equipment decreases
2. Voltage Regulation Problems
Excessive current causes voltage drops that:
- Reduce motor starting torque by up to 19% (voltage drop squared relationship)
- Cause lighting flicker and computer malfunctions
- Trigger protective devices unnecessarily
- Decrease equipment lifespan
3. Energy Losses and Heat Generation
I²R losses increase exponentially with current:
- 10% current increase = 21% more heat losses
- Higher cooling costs for electrical rooms
- Reduced equipment ratings due to temperature stress
- Fire hazards from overheated conductors
Power Factor Correction Methods: Complete Comparison
| Method | Initial Cost | Maintenance | Efficiency | Best Applications |
|---|---|---|---|---|
| Fixed Capacitor Banks | $30-50/kVAR | Very Low | 95-97% | Steady loads, simple systems |
| Automatic Capacitor Banks | $70–120/kVAR | Low | 95-97% | Variable loads, most facilities |
| Synchronous Condensers | $250–400+/kVAR | High | 95-98% | Large industrial, grid support |
| Active Electronic PFC | $200–350/kVAR | Medium | 95-99% | Harmonic-rich environments |
| Static VAR Compensators | $200–400/kVAR | Medium | 96-99% | Rapid load changes, arc furnaces |
1. Fixed Capacitor Banks - Most Cost-Effective
Fixed capacitors provide constant reactive power compensation and are ideal for facilities with steady loads.
Advantages:
- Lowest initial cost ($1,500-4,000 for typical installations)
- Minimal maintenance requirements
- Simple installation and operation
- 15-20 year equipment life
Typical Applications:
- Manufacturing with consistent motor loads
- Water treatment plants
- Small commercial buildings
Equipment Costs:
- 25 kVAR bank: $750-1,250
- 50 kVAR bank: $1,500-2,500
- 100 kVAR bank: $3,000-5,000
- 200 kVAR bank: $6,000-10,000
2. Automatic Capacitor Banks - Most Popular
Automatic switching capacitor banks adjust reactive power compensation based on load conditions, providing optimal power factor across varying demands.
Key Features:
- 4-12 switching steps for precise control
- Power factor controllers with digital displays
- Harmonic protection and detuning reactors
- Remote monitoring capabilities
Equipment Costs:
| Capacity | Steps | Voltage | Price Range | Best For |
|---|---|---|---|---|
| 50 kVAR | 3-step | 480V | $4,500-7,500 | Small facilities (50-200kW) |
| 100 kVAR | 4-step | 480V | $7,000-12,000 | Medium facilities (200-500kW) |
| 200 kVAR | 6-step | 480V | $12,000-20,000 | Large facilities (500kW-1MW) |
| 400 kVAR | 8-step | 480V | $20,000-35,000 | Industrial plants (1-2MW) |
3. Active Power Factor Correction
Active PFC uses electronic circuits to shape the input current waveform, achieving near-unity power factor with excellent regulation across varying loads.
Best for: Variable frequency drives, switching power supplies, and applications requiring precise power factor control.
4. Synchronous Condensers
Synchronous condensers are synchronous motors operating without mechanical load. They provide both leading and lagging reactive power, making them ideal for large industrial applications requiring flexible reactive power control.
Power Factor Correction Calculator: Step-by-Step Examples
Example 1: Small Manufacturing Plant
Scenario: A machine shop with consistent motor loads needs power factor improvement.
Given Data:
- Real Power (P): 200 kW
- Current Power Factor: 0.72
- Target Power Factor: 0.95
- Utility Rate: $9.50/kVA demand charge
- Current Penalty: 15% for PF < 0.8
Step 1: Calculate Current Reactive Power
Step 2: Calculate Target Reactive Power
Step 3: Required Capacitor Size
Select: 130 kVAR fixed capacitor bank
Step 4: Financial Analysis
Current Situation:
- Apparent Power: P ÷ PF = 200 ÷ 0.72 = 277.8 kVA
- Monthly Demand Charge: 277.8 × $9.50 = $2,639
- Penalty (15%): $396
- Total Monthly Cost: $3,035
After Correction:
- Apparent Power: 200 ÷ 0.95 = 210.5 kVA
- Monthly Demand Charge: 210.5 × $9.50 = $2,000
- Penalty: $0
- Total Monthly Cost: $2,000
Monthly Savings: $1,035 Equipment Cost: $6,500 Payback Period: 6.3 months
Example 2: Variable Load Commercial Building
Scenario: Office building with HVAC and mixed loads requiring automatic power factor correction.
Given Data:
- Peak Load: 400 kW
- Minimum Load: 150 kW
- Current Power Factor Range: 0.68-0.82
- Target: Maintain 0.95+ at all load levels
- Utility Penalty: 20% below 0.8 PF
Load Analysis:
| Time Period | Load (kW) | Current PF | Required kVAR |
|---|---|---|---|
| Peak (2-6 PM) | 400 | 0.68 | 250 |
| Normal (8 AM-2 PM) | 300 | 0.75 | 150 |
| Light (6 PM-8 AM) | 150 | 0.82 | 50 |
Solution: 250 kVAR automatic capacitor bank with 5 steps (50 kVAR each)
Equipment Cost: $15,000 Installation Cost: $3,500 Total Investment: $18,500
Savings Calculation:
- Average penalty reduction: $2,400/month
- Demand charge reduction: $800/month
- Total Monthly Savings: $3,200
- Payback Period: 5.8 months
Example 3: Industrial Plant with Harmonics
Scenario: Manufacturing facility with VFDs and nonlinear loads requiring harmonic filtering.
Given Data:
- Total Load: 800 kW
- Power Factor: 0.65
- Total Harmonic Distortion (THD): 18%
- Requires harmonic mitigation
Solution: Detuned capacitor bank with 7% reactor
- Capacitor Rating: 450 kVAR
- Reactor Rating: 31.5 kVAR (7%)
- Net Compensation: 418.5 kVAR
Equipment Costs:
- Detuned capacitor bank: $35,000
- Harmonic analysis and design: $5,000
- Installation and commissioning: $8,000
- Total Investment: $48,000
Annual Savings:
- Penalty elimination: $45,600
- Demand charge reduction: $28,800
- Reduced losses: $12,000
- Total Annual Savings: $86,400
- Payback Period: 6.7 months
Equipment Selection Guide: Choosing the Right Solution
Facility Size and Load Assessment
Small Facilities (50-200 kW)
- Typical Applications: Retail, small manufacturing, restaurants
- Recommended: Fixed or 2-3 step automatic banks
- Budget: $3,000-8,000
Medium Facilities (200-500 kW)
- Typical Applications: Strip malls, medium manufacturing, schools
- Recommended: 4-6 step automatic banks with power factor controller
- Budget: $10,000-25,000
Large Facilities (500kW-2MW)
- Typical Applications: Large manufacturing, hospitals, universities
- Recommended: 6-12 step automatic with harmonic protection
- Budget: $25,000-80,000
Load Type Considerations
Steady Loads (Motors, Heaters)
- Fixed capacitors adequate
- Size for maximum load
- Simple installation and maintenance
Variable Loads (HVAC, Mixed Systems)
- Automatic switching required
- Size for peak reactive power need
- Consider daily/seasonal load patterns
Nonlinear Loads (VFDs, LED Lighting, Computers)
- Detuned capacitors mandatory
- Harmonic analysis required
- Higher initial cost but prevents resonance
Voltage Level Selection
Low Voltage (208-600V)
- Most common for facilities under 2MW
- Easier installation and maintenance
- More vendor options available
Medium Voltage (2.4kV-35kV)
- Large industrial applications
- Lower current, smaller cables
- Higher efficiency, lower losses
Advanced Capacitor Sizing Formulas
Multiplier Method for Quick Calculations
For common power factor improvements, use these multipliers:
| From PF → To PF | 0.90 | 0.95 | 0.98 |
|---|---|---|---|
| 0.60 | 0.849 | 1.030 | 1.248 |
| 0.65 | 0.714 | 0.895 | 1.113 |
| 0.70 | 0.591 | 0.772 | 0.990 |
| 0.75 | 0.477 | 0.658 | 0.876 |
| 0.80 | 0.369 | 0.550 | 0.768 |
| 0.85 | 0.266 | 0.447 | 0.665 |
Formula: Required kVAR = kW × Multiplier
Exact Calculation Method
For precise sizing:
Where:
- θ₁ = arccos(existing power factor)
- θ₂ = arccos(desired power factor)
Harmonic Detuning Calculations
For systems with harmonics, calculate detuned reactor size:
Where:
- XL = Reactor reactance
- XC = Capacitor reactance
- n = Tuning frequency (typically 4.7 for 7% reactor)
Implementation Best Practices and Common Pitfalls
Pre-Installation Analysis
Power Quality Survey
Conduct a comprehensive 7-day survey to capture:
- Load patterns and power factor variations
- Harmonic content analysis
- Voltage stability assessment
- Equipment operating characteristics
Economic Analysis
Calculate total cost of ownership:
- Equipment and installation costs
- Utility penalty savings
- Demand charge reduction
- Energy loss reduction
- Maintenance costs over equipment life
Installation Guidelines
Electrical Design
- Install upstream of motors and loads
- Provide individual switching and protection
- Use contactors rated for capacitive switching
- Install current transformers for automatic control
Protection Requirements
- Overcurrent protection for each capacitor
- Undervoltage release for safety
- Harmonic protection where required
- Temperature monitoring for reliability
Common Implementation Mistakes
1. Oversizing Capacitors
- Problem: Installing too much capacitance leads to leading power factor
- Solution: Proper load analysis and staged switching
- Warning Signs: Voltage rise, power factor penalties persist
2. Ignoring Harmonics
- Problem: Resonance between capacitors and system inductance
- Solution: Harmonic analysis and detuned reactors
- Warning Signs: Equipment overheating, nuisance tripping
3. Poor Location Selection
- Problem: Capacitors installed too far from loads
- Solution: Distribute correction close to major loads
- Benefits: Improved voltage regulation, reduced losses
Maintenance and Monitoring Guidelines
Preventive Maintenance Schedule
Monthly Inspections
- Visual inspection for physical damage
- Check cooling fans and ventilation
- Monitor power factor controller displays
- Record operating temperatures
Quarterly Tasks
- Clean capacitor units and enclosures
- Check electrical connections for tightness
- Test switching contactors
- Verify protection device settings
Annual Maintenance
- Capacitor testing (power factor, insulation)
- Control system calibration
- Power quality analysis
- Performance benchmarking
Performance Monitoring
Key Metrics to Track
- Power factor by time of day
- Reactive power demand
- Harmonic distortion levels
- Equipment temperatures
- Utility demand charges
Diagnostic Tools
- Power quality analyzers
- Thermal imaging cameras
- Insulation testers
- Capacitor analyzers
Real-World Case Studies and ROI Analysis
Case Study 1: Automotive Manufacturing Plant
Challenge:
A 2 MW facility operating at an average power factor of 0.72, resulting in $6,500/month in penalties from the utility. The load profile is moderately variable with welding machines and motor-driven processes.
Solution:
Installed a 450 kVAR automatic capacitor bank with detuned harmonic filters.
Investment:
~$55,000 (≈ $120/kVAR including detuning reactors and installation).
Results:
- Power factor improved from 0.72 → 0.95
- Penalties eliminated (savings: $6,500/month)
- Payback: 8.5 months
- 5-year ROI: ~700%
Case Study 2: Hospital Complex
Challenge:
A hospital with 1.2 MW peak demand running at 0.75 power factor, facing penalties and voltage instability affecting sensitive MRI and surgical equipment.
Solution:
Deployed 2 × 300 kVAR redundant automatic capacitor banks with emergency bypass and step control to handle variable loads.
Investment:
~$80,000 (≈ $135/kVAR due to redundancy and medical-grade installation requirements).
Results:
- Power factor improved from 0.75 → 0.97
- Penalties reduced by $4,200/month
- Transformer loading reduced by 12%
- Payback: ~19 months
- Added value: enhanced reliability and voltage stability for critical medical equipment
Case Study 3: Data Center
Challenge:
A 1.5 MW data center with high harmonic content from UPS systems and server power supplies. Utility imposed penalties for low power factor and excessive harmonic distortion.
Solution:
Installed an active harmonic filter + 500 kVAR automatic bank (hybrid solution).
Investment:
~$130,000 (active filters are more expensive at ~$200–250/kVAR equivalent).
Results:
- Power factor improved from 0.70 → 0.98
- Utility penalties reduced by $10,000/month
- UPS efficiency improved by 2–3%, lowering cooling costs
- Payback: ~13 months
- Improved compliance with IEEE 519 harmonic standards, extending equipment life
Future Trends in Power Factor Correction
Smart Grid Integration
Modern power factor correction systems increasingly feature:
- Remote monitoring and control capabilities
- Integration with building management systems
- Predictive maintenance algorithms
- Dynamic optimization based on utility rates
Advanced Control Technologies
Adaptive Control Systems
- Real-time load analysis
- Automatic harmonic detection
- Optimal switching strategies
- Continuous performance optimization
IoT-Enabled Monitoring
- Cloud-based data analytics
- Mobile app integration
- Predictive failure detection
- Performance benchmarking
Regulatory Changes
Grid Modernization Requirements
- Stricter power factor standards
- Harmonic emission limits
- Real-time power quality monitoring
- Penalties for grid instability
Conclusion: Maximizing Your Power Factor Correction Investment
Power factor correction represents one of the fastest-payback electrical improvements available to industrial and commercial facilities. With typical payback periods of 6-18 months and benefits lasting 15-20 years, PFC systems deliver exceptional returns while improving operational reliability.
Key Success Factors:
- Comprehensive Analysis: Understand your load patterns and power quality requirements
- Proper Sizing: Use accurate calculations and consider future growth
- Quality Equipment: Invest in proven technology with proper protection
- Professional Installation: Ensure compliance with codes and standards
- Ongoing Monitoring: Track performance and maintain equipment properly
Action Steps:
- Conduct a power factor audit of your facility
- Calculate potential savings using utility penalty structures
- Obtain quotes from qualified vendors
- Implement correction in phases if needed
- Monitor results and optimize performance
The combination of immediate cost savings, improved system capacity, and enhanced equipment reliability makes power factor correction essential for competitive operations. Start with a comprehensive power quality analysis to identify opportunities and begin realizing benefits within months of implementation.
Ready to optimize your electrical system's performance and eliminate costly utility penalties? Use our step-by-step calculations and equipment selection guide to develop a customized power factor correction strategy that maximizes your savings and system efficiency.
🔗 Related Posts
- Variable Frequency Drives: Complete Energy Savings Guide
- Electric Current: Comprehensive Measurement Guide
- Voltage Drop Calculator: Complete Analysis Guide
- Wire Size Calculator with NEC Requirements
- Circuit Breaker Sizing: Complete Safety Guide
Helpful Calculators
- Voltage Drop Calculator
- Ohm's Law Calculator
- Power Factor Calculator
- Capacitor and Inductor Reactance Calculator
Credits
Photo by Thomas Kelley on Unsplash
⭐ Was this article helpful?
IDAR Mohamed
Electrical Engineer
Electrical Engineer specialized in power systems, electrical installations, and energy efficiency. Passionate about simplifying complex electrical concepts into practical guides. (University of applied sciences graduate, with experience in HV/LV systems and industrial installations.)
- Power Factor Correction
- Reactive Power
- Capacitors
- Electrical Systems